Track your nutrition and health goals

Garmin Health Metrics Explained: Body Battery, HRV, Stress Score, Sleep and VO2 Max
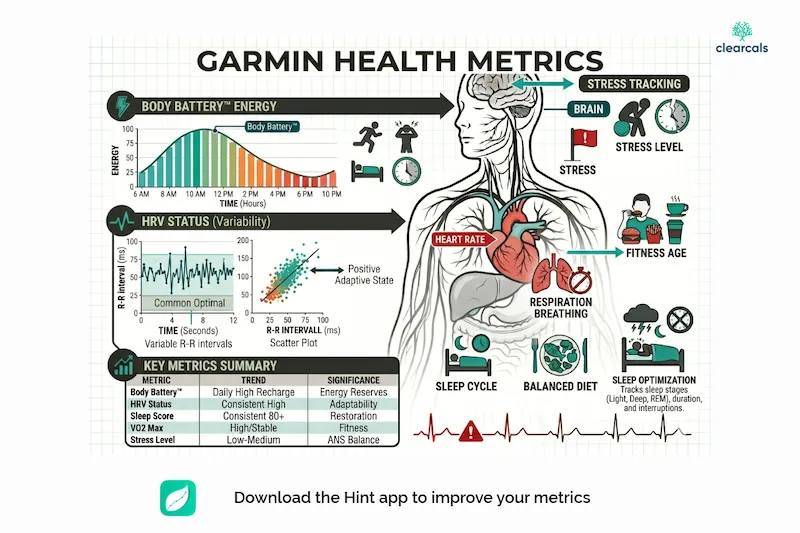
By Dr. Krishna Athmakuri, Co-Founder & CEO, Clearcals | Updated: May 2026
What Your Garmin Watch Is Actually Measuring
Most Garmin watch owners glance at their metrics daily without fully understanding what the numbers mean or what to do with them. Body Battery at 45 — is that good or bad? HRV Status showing "Unbalanced" — should you be concerned? Stress Score of 67 at 3 pm — what caused that?
This guide explains every core Garmin health metric in plain language: what the sensor actually measures, how Garmin calculates the number, what a good vs. concerning reading looks like, and — most importantly — what action to take based on what you see.
Body Battery
What It Measures
Body Battery is Garmin's proprietary energy-level metric — a single number from 0 to 100 representing your current physiological reserve. It is not a measure of how you feel; it is a measure of how recovered your body actually is, based on objective sensor data.
Garmin calculates Body Battery by combining three inputs: HRV data (the primary driver, measured continuously via the optical heart rate sensor), sleep quality (duration and restfulness), and activity and stress levels throughout the day.
What the Numbers Mean
- 75–100: Excellent recovery. Your body has a significant physiological reserve. This is the range in which high-intensity training, cognitively demanding work, and major stressors can be handled effectively and adapted to.
- 50–74: Good recovery. Normal daily activities and moderate exercise are well-supported. High-intensity training is possible, but adaptation may be slightly reduced compared to a fully charged state.
- 25–49: Moderate. You have enough reserve for routine activities, but high-intensity exercise or major stressors will drain reserve faster than normal, and adaptation will be compromised.
- 0–24: Low reserve. The body is in a recovery deficit. Attempting hard training in this state primarily increases injury risk and hormonal stress without producing training adaptation.
How Body Battery Changes Through the Day
Body Battery charges during sleep and drains during waking activity, stress, and exercise. A well-recovered sleeper will typically wake with a Body Battery of 80–100. Light activity during the day produces a slow drain; intense exercise produces a rapid, steep drop. High stress — even without physical activity — drains Body Battery significantly.
The most useful insight Body Battery provides is not the current reading but the daily pattern. Consistently waking with a Body Battery below 70, despite sleeping 7+ hours, typically indicates one of three things: poor sleep quality (fragmented or insufficient deep and REM sleep), high chronic stress, or an underlying health issue affecting overnight recovery (such as sleep apnoea or overtraining syndrome).
What to Do
- Morning Body Battery below 50 → prioritise sleep, reduce training intensity, investigate stress sources
- Body Battery reaching zero by early afternoon regularly → caloric deficit may be too aggressive, or training volume is too high relative to recovery capacity
- Body Battery remaining high despite training → your training stimulus may be insufficient to drive adaptation (the body isn't being challenged enough)
HRV Status
What HRV Actually Is
Heart rate variability is the variation in the time interval between consecutive heartbeats. If your heart beats 60 times per minute, it does not beat exactly once every 1,000 milliseconds — the intervals vary slightly, ranging from perhaps 950ms to 1,050ms. This variation is driven by the autonomic nervous system.
When the parasympathetic nervous system (rest, digest, recover) is dominant, HRV is high — the heart responds fluidly to respiratory signals and other internal cues. When the sympathetic nervous system (fight, flight, stress) is dominant, HRV drops — the heart beats more rigidly and regularly. Counter-intuitively, a very regular, metronomic heartbeat is a sign of physiological stress, not calm.
How Garmin Measures It
Garmin measures HRV during sleep, typically analysing the first 5 hours of the night when sleep is most consistent. It presents two numbers: the nightly HRV value and a 5-night rolling average compared to your personal baseline (established over the first 3 weeks of wearing the watch).
HRV baselines are highly individual — a 45-year-old woman's healthy HRV baseline might be 38ms, while a trained 28-year-old male athlete's baseline might be 72ms. Garmin's HRV Status feature compares you to your own baseline rather than population averages, which is what makes it clinically meaningful.
HRV Status Categories
- Balanced: Your current HRV is within your normal range. Your autonomic nervous system is managing stress and recovery effectively.
- Unbalanced: Your HRV is outside your normal range — either unusually high (rare, can indicate very high recovery) or more commonly trending lower than your baseline. Warrants attention but not alarm.
- Low: Your HRV has been trending below your baseline for several consecutive days. This is a meaningful signal of accumulated physiological stress — from overtraining, illness onset, chronic sleep deprivation, or major psychological stress.
- Poor: Your HRV is significantly and persistently below your baseline. This is a strong signal to reduce training load significantly and investigate lifestyle factors aggressively.
What Drives HRV Changes
HRV drops predictably in response to: intense exercise (expected, recovers within 24–48 hours in healthy athletes), alcohol consumption (even 1–2 units significantly suppresses HRV for the following night), illness (often the earliest detectable signal, appearing 12–24 hours before other symptoms), chronic stress, and severe caloric restriction.
HRV improves with: adequate sleep, aerobic fitness (long-term), effective stress management practices, good nutrition, and gradual reduction in training load during recovery phases.
What to Do
- HRV Status showing Unbalanced or Low for 3+ consecutive days → reduce training intensity by 30–40%, ensure 8+ hours of sleep, evaluate diet adequacy, and consider whether illness may be a factor
- HRV shows a sudden large drop → consider whether alcohol, a late meal, or unusual stress the previous day explains it; if not, monitor closely for illness symptoms
- HRV trending consistently upward over weeks → a reliable sign of improving cardiovascular fitness and recovery capacity
Stress Score
What It Measures
Garmin's Stress Score is calculated from HRV data during periods when you are not actively exercising. When the body is under physiological stress — whether from work pressure, an argument, caffeine, hunger, illness, or intense exercise — HRV drops and the Stress Score rises. When relaxed and recovered, HRV rises and the Stress Score falls.
The Stress Score ranges from 0–100 and is updated continuously throughout the day:
- 1–25: Rest (low physiological activation)
- 26–50: Low stress
- 51–75: Medium stress
- 76–100: High stress
The Key Insight: Physiological vs. Psychological Stress
The Stress Score measures physiological stress — the body's autonomic response — not subjective feelings. This makes it simultaneously more and less useful than it appears. More useful because it can reveal stress you are not consciously aware of (chronic low-grade stress that has become "normal" is a common pattern). Less intuitively useful because exercise — which is deliberately stressful and beneficial — also raises the Stress Score and is not distinguished from harmful psychological stress in real time.
The most valuable application of the Stress Score is pattern analysis over time, not single readings. A Stress Score that is consistently elevated between 18:00 and 22:00 regardless of the day suggests a systemic evening stress response — possibly from late caffeine, late eating, evening screen exposure, or habitual late-night work. Identifying this pattern is not possible from a single reading.
Rest Minutes
Garmin also tracks daily Rest Minutes — periods when your Stress Score is in the 1–25 range for at least 3 consecutive minutes. Rest Minutes reflect the body's actual physiological downtime rather than the time you spent sitting at a desk under moderate stress. Garmin recommends at least 30–60 minutes of physiological rest daily.
What to Do
- Consistently high Stress Score (>50) outside of exercise → investigate caffeine intake timing, sleep schedule, evening habits, and psychological stressors; consider breathwork or meditation (proven to shift autonomic balance toward parasympathetic)
- Stress Score elevated on rest days when no exercise has occurred → the body may be fighting an infection, or cumulative training and life stress has exceeded recovery capacity
- Very low Stress Score consistently + high Body Battery → positive sign; the body is in an effective recovery state
Sleep Score and Sleep Tracking
What Garmin Tracks During Sleep
Garmin uses optical heart rate data, HRV, accelerometer movement, and (on compatible models) pulse oximetry (SpO2) to classify sleep into four stages: Awake, Light sleep, Deep sleep, and REM sleep. From this, it calculates a Sleep Score from 0–100.
The Sleep Score accounts for: total sleep duration (40% of the score), sleep stage quality — particularly the proportion of time in Deep and REM sleep (40%), and restlessness and awakenings (20%).
Sleep Stage Targets
- Deep sleep (slow wave sleep): Physically restorative; growth hormone secretion, tissue repair, and immune function occur primarily during deep sleep. Adults typically spend 15–20% of total sleep time in deep sleep. Deep sleep declines significantly with age and is the stage most suppressed by alcohol.
- REM sleep: Cognitive and emotional processing; memory consolidation and emotional regulation. Adults should spend 20–25% of total sleep time in REM. REM is suppressed by alcohol, many medications, and sleep fragmentation.
- Light sleep: Transitional stage; makes up the majority of the night (50–60%). Important for overall recovery, but not the target stage for quality improvement.
SpO2 and Sleep Apnoea Detection
Compatible Garmin models (Vivoactive 6, Forerunner 265 and above, Instinct 3, Fenix 8) measure blood oxygen (SpO2) continuously overnight. Consistently low overnight SpO2 (below 90%) or large fluctuations in SpO2 during sleep may indicate sleep-disordered breathing. Garmin does not diagnose sleep apnoea but can flag patterns that warrant clinical investigation — particularly relevant given that sleep apnoea is significantly underdiagnosed in India.
What to Do
- Sleep Score consistently below 60 → investigate sleep duration first (most Indian adults are chronically sleep-deprived), then sleep quality (alcohol, screen exposure, sleep schedule consistency)
- Low Deep sleep proportion → avoid alcohol within 3 hours of sleep, ensure the room is cool (18–20°C is the optimal sleep temperature), and maintain a consistent sleep schedule
- Low REM proportion → evaluate total sleep duration (REM sleep is concentrated in the later half of the night; short sleep disproportionately cuts REM time)
- Erratic SpO2 overnight → consult a physician; a formal sleep study may be warranted
VO2 Max
What It Means for Health
VO2 Max (maximal oxygen uptake) is the maximum rate at which your body can consume oxygen during maximum-effort exercise, expressed in millilitres of oxygen per kilogram of body weight per minute (ml/kg/min). It is the gold-standard measure of cardiorespiratory fitness and one of the strongest known predictors of longevity.
A landmark study of over 122,000 patients found that low cardiorespiratory fitness (low VO2 Max) was associated with a higher risk of all-cause mortality than smoking, diabetes, or hypertension — making it arguably the single most important health metric most people never measure.
How Garmin Estimates It
Garmin estimates VO2 Max from outdoor running data: it analyses the relationship between your GPS pace and your heart rate over a run of at least 10 minutes. The accuracy is well-validated — multiple studies show Garmin's estimate falls within 3–5% of laboratory VO2 Max values measured on a treadmill with expired gas analysis.
For walking only, Garmin provides a walking VO2 Max estimate that is less precise but still directionally useful. The running estimate requires GPS and heart rate data from an outdoor activity.
VO2 Max Reference Ranges for India
Note that VO2 Max norms developed in Western populations are less applicable to Indian adults, who typically have lower baseline cardiorespiratory fitness due to lower habitual physical activity levels. General directional guidance:
| Category | Men (ml/kg/min) | Women (ml/kg/min) |
|---|---|---|
| Low | Below 35 | Below 28 |
| Fair | 35–42 | 28–34 |
| Good | 42–50 | 34–40 |
| Excellent | Above 50 | Above 40 |
What Drives VO2 Max Improvement
VO2 Max is improved by sustained aerobic exercise — the most effective being zone 2 training (moderate intensity, conversational pace) performed consistently over months, with periodic high-intensity interval sessions. Improvements of 10–15% are achievable in previously sedentary individuals within 3–6 months of consistent training.
What to Do
- VO2 Max below 35 (men) or 28 (women) → prioritise aerobic activity as a health priority equivalent to medication; even 30 minutes of brisk walking daily produces meaningful improvement over 3–6 months
- VO2 Max declining despite consistent training → may indicate overtraining, inadequate caloric intake, or cumulative fatigue; reduce training volume temporarily
- VO2 Max improving consistently → one of the most reliable objective signs that a fitness programme is producing genuine health benefits
👉 Full guide: VO2 Max and Garmin: Everything You Need to Know
Resting Heart Rate
What It Tells You
Resting heart rate (RHR) is the number of times your heart beats per minute when completely at rest. Garmin measures it from overnight heart rate data — specifically the average of the lowest 30-minute period during sleep, when external variables are minimised.
A lower RHR generally indicates a more efficient cardiovascular system: the heart is capable of pumping the required blood volume per beat, requiring fewer beats per minute to maintain circulation. In well-trained endurance athletes, RHR values of 40–50 bpm are common; the general healthy adult range is 60–100 bpm, though values in the 50–70 range are preferable for metabolic health.
The Trend Matters More Than the Number
A single RHR reading has limited meaning. The value of Garmin's continuous RHR tracking is the trend: consistent downward movement in RHR over weeks and months of aerobic exercise training is among the most reliable objective signs of cardiovascular adaptation.
Conversely, an acute RHR increase of 5 or more beats per minute above your recent average — particularly in the absence of a known explanation — is a reliable early warning signal. This pattern typically precedes illness symptoms by 12–24 hours, appears during overtraining syndrome before performance declines, and reflects inadequate sleep acutely. Catching this signal early allows intervention before the situation compounds.
What to Do
- RHR trending downward over months → positive sign of cardiovascular adaptation to training
- Acute RHR spike (5+ bpm above recent average) → suspect illness onset, overtraining, or severe sleep deprivation; reduce training intensity until RHR normalises
- Chronically elevated RHR (>80 bpm) despite months of exercise → evaluate sleep quality, stress levels, caffeine intake, and thyroid function (hypothyroidism raises RHR)
How to Read All Your Metrics Together
Individual metrics have limited meaning in isolation. The real value of Garmin health data is in the patterns they form together:
The "recover day" pattern: Low Body Battery + Low HRV Status + Elevated Stress Score + Poor Sleep Score = your body is signalling that it needs recovery, regardless of what your training plan says. Training hard in this state produces minimal adaptation and high injury risk.
The "peak readiness" pattern: High Body Battery (80+) + Balanced HRV + Low Stress Score + Sleep Score above 75 = optimal conditions for hard training, demanding cognitive work, or high-stakes events. These days are rare — use them intentionally.
The "chronic stress" signal: Stress Score persistently elevated across multiple days + Body Battery draining faster than usual + HRV trending below baseline = accumulated physiological stress from lifestyle factors (not just training). Review sleep, nutrition, psychological stressors, and alcohol.
The "illness incoming" pattern: Sudden HRV drop + elevated RHR + higher than usual Stress Score despite no additional training or known stressor = frequently precedes illness by 24–48 hours. Reduce training immediately.
References
- Plews DJ, et al. Training adaptation and heart rate variability in elite endurance athletes: opening the door to effective monitoring. Sports Medicine. 2013;43(9):773–781.
- Myers J, et al. Exercise capacity and mortality among men referred for exercise testing. New England Journal of Medicine. 2002;346(11):793–801.
- Passler S, et al. Validity of wrist-worn activity trackers for estimating VO2max. International Journal of Environmental Research and Public Health. 2019;16(17):3037.
- Grandner MA, et al. Sleep duration and diabetes risk: population trends and potential mechanisms. Current Diabetes Reports. 2016;16(11):106.
- Fatisson J, et al. Influence diagram of physiological and environmental factors affecting heart rate variability. Heart International. 2016;11(1):e32–e40.
- Stahl SE, et al. Accuracy of heart rate watches: implications for weight management. PLOS ONE. 2016;11(5):e0154420.
About the Author
Dr. Krishna Athmakuri is the Co-Founder and CEO of Clearcals, where he leads the development of data-driven health technology through the Hint app.
With a Ph.D. in Chemical Engineering from Rensselaer Polytechnic Institute, New York, his expertise spans analytics, protein chemistry, and biotechnology.
Earlier in his career, he developed biotherapeutics for diabetes and metabolic diseases at companies like Aurobindo Pharma and Dr. Reddy's Laboratories.
At Clearcals, he now applies that scientific rigour to build personalised fitness tools — including Hint Pro Workouts, nutrition tracking, and real-time metabolic insights — helping users make smarter health decisions through technology.
Connect with Dr. Krishna on LinkedIn
👉 Back to the pillar page: Garmin Watches India: Complete Guide 👉 Related: Garmin Body Battery | VO2 Max and Garmin | Garmin Connect Guide