Track your nutrition and health goals

HRV Normal Range by Age: Chart, Reference Values and What Your Score Means
By Dr. Krishna Athmakuri, Co-Founder & CEO, Clearcals | Updated: May 2026
Why HRV Ranges Are So Individual
Heart rate variability is one of the most personal health metrics you can track — far more so than blood pressure, cholesterol, or blood glucose, for which population-derived thresholds are clinically meaningful.
Two healthy 35-year-olds with identical fitness levels, similar diets, and no chronic conditions can have resting HRV values that differ by 40–50%. Both are completely normal. Both are within their own healthy range.
This is not a flaw in HRV measurement — it reflects genuine biological individuality in autonomic nervous system function, cardiac structure, and vagal tone.
This has an important practical implication: your HRV number means almost nothing in isolation. What matters is your trend over time, and how your current value compares to your own established baseline.
The reference ranges below provide directional guidance — a starting point for understanding whether your HRV is broadly in the expected zone for your age — but your personal baseline, established over 3–4 weeks of consistent measurement, is the standard against which day-to-day HRV status should be interpreted.
Which HRV Metric Are We Talking About?
Before reading any HRV reference table, it is essential to know which metric is being reported. Different devices and research papers use different HRV calculations, and values are not interchangeable.
RMSSD (Root Mean Square of Successive Differences) is the metric used by Garmin, WHOOP, Oura Ring, and most modern consumer wearables. It reflects primarily parasympathetic (vagal) nervous system activity and is the most reliable metric for day-to-day health monitoring. All reference values in this guide use RMSSD.
SDNN (Standard Deviation of Normal-to-Normal intervals) is used by the Apple Watch and reported in the Apple Health app. SDNN reflects both sympathetic and parasympathetic activity and produces higher numerical values than RMSSD for the same person. A person with an RMSSD of 45ms might have an SDNN of 65–75ms. The two metrics cannot be directly compared.
If you are using a Garmin device, the HRV values shown in Garmin Connect are RMSSD measured overnight — use the RMSSD table below. If you are using an Apple Watch, values shown in the Health app are SDNN — these are typically 30–50% higher than the RMSSD equivalents and should not be compared against the RMSSD reference ranges below.
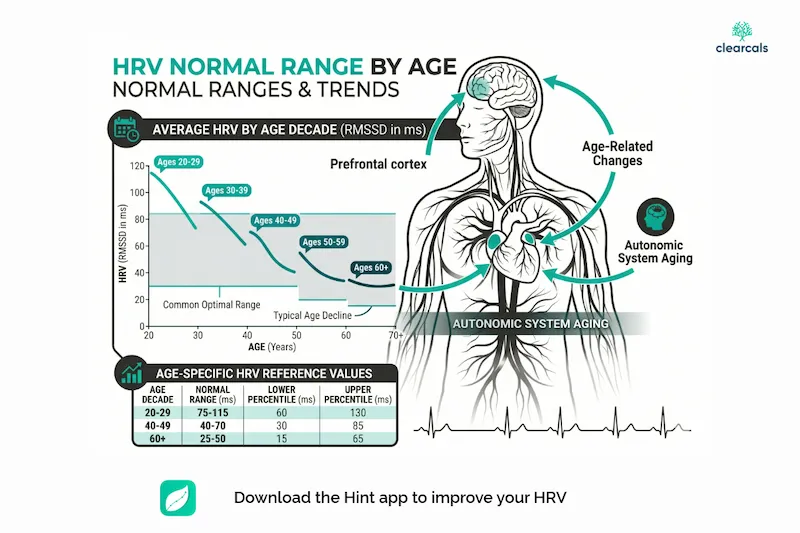
HRV Normal Range by Age (RMSSD, Overnight Measurement)
The following values represent population-derived RMSSD ranges from large observational studies measuring HRV during sleep or standardised resting conditions. Values represent healthy adults without cardiovascular disease, diabetes, or significant metabolic conditions.
| Age Group | Low (ms) | Below Average (ms) | Average (ms) | Good (ms) | Excellent (ms) |
|---|---|---|---|---|---|
| 18–25 years | Below 35 | 35–50 | 50–70 | 70–95 | Above 95 |
| 26–35 years | Below 30 | 30–45 | 45–65 | 65–85 | Above 85 |
| 36–45 years | Below 25 | 25–38 | 38–58 | 58–75 | Above 75 |
| 46–55 years | Below 20 | 20–32 | 32–50 | 50–65 | Above 65 |
| 56–65 years | Below 16 | 16–27 | 27–42 | 42–58 | Above 58 |
| Above 65 years | Below 12 | 12–22 | 22–36 | 36–50 | Above 50 |
Important caveats:
- These ranges assume overnight/resting RMSSD measurement. Daytime spot measurements are 20–40% lower than overnight values in the same person.
- Trained endurance athletes often exceed the "Excellent" threshold by 50–100% — their autonomic adaptation pushes HRV well above typical population ranges.
- Indian adults in published studies tend to fall in the lower half of these ranges due to higher baseline metabolic burden and lower average aerobic fitness compared to Western reference populations.
HRV by Age: Why the Decline Happens
HRV declines consistently with age — a finding so robust that HRV has been proposed as a biological age marker. The decline reflects several overlapping processes:
Reduced intrinsic heart rate variability: The sinoatrial node (the heart's natural pacemaker) develops age-related changes that reduce its responsiveness to autonomic input, lowering the range of beat-to-beat variation it can produce regardless of nervous system signals.
Progressive reduction in parasympathetic tone: Vagal tone declines with age as the efferent vagal fibres to the heart reduce in number and conduction velocity. This shifts autonomic balance toward sympathetic dominance.
Accumulating metabolic burden: Most people accumulate metabolic risk factors — increasing visceral fat, declining insulin sensitivity, rising blood pressure, worsening sleep quality — as they age. Each of these independently suppresses HRV, amplifying the intrinsic age-related decline.
The good news: The metabolic contribution to age-related HRV decline is modifiable. Studies consistently show that physically active older adults maintain HRV values equivalent to sedentary adults 10–15 years younger, and that exercise interventions in older adults produce significant HRV improvement regardless of starting age.
Gender Differences in HRV
Women generally have higher HRV than age-matched men during the reproductive years, with the gap most pronounced in the 25–45 age group. The primary driver is oestrogen, which enhances cardiac parasympathetic tone through multiple mechanisms, including direct effects on muscarinic receptors and modulation of vagal ganglia. This means women using the above table should expect to fall toward the upper half of each range during reproductive years.
Menopause substantially narrows this gap. The oestrogen withdrawal of menopause reduces parasympathetic tone, and post-menopausal women's HRV values converge toward male reference ranges. Women experiencing significant perimenopausal or post-menopausal HRV decline — particularly if accompanied by sleep disruption and increased resting heart rate — should consider this hormonal context when interpreting their trend.
Menstrual cycle fluctuations: HRV varies across the menstrual cycle, being highest during the follicular phase (days 1–14) and lowest in the late luteal phase (days 21–28) — a variation of 5–15% that can produce confusing day-to-day swings on a wearable. Tracking HRV at the same phase of the cycle, month-to-month, produces more meaningful trend comparisons.
What Is a Good HRV Score?
"Good HRV" is context-dependent and cannot be answered with a single number. The more useful questions are:
Is your HRV within the average range for your age? If yes, your autonomic nervous system is functioning broadly normally. If it sits in the "Low" or "Below Average" zone, chronic metabolic, lifestyle, or health factors are likely suppressing it.
Is your HRV trending upward over the past 3–6 months? An upward trend — even if values remain below population averages — is a reliable sign that lifestyle interventions are improving your autonomic function and, by extension, your metabolic health.
Is your HRV stable relative to your personal baseline? Day-to-day HRV swings of 10–20% are normal. Swings larger than 20% below your baseline on consecutive days warrant attention — they signal acute physiological stress from illness, overtraining, inadequate sleep, or alcohol.
What is a dangerously low HRV? There is no universally agreed clinical threshold for "dangerous" HRV in otherwise healthy individuals. In clinical cardiology, a 24-hour SDNN below 50ms is associated with significantly elevated cardiovascular mortality risk in post-myocardial infarction patients — but this metric and context differ from consumer wearable RMSSD values. For general health monitoring purposes, an RMSSD consistently below the "Low" threshold for your age group over several weeks warrants investigation of the contributing factors (sleep, metabolic health, fitness, stress) and discussion with a physician if no lifestyle explanation is apparent.
Factors That Affect Your HRV Baseline
Understanding what legitimately moves HRV up and down prevents misinterpretation of normal fluctuations as health problems.
Acutely lowers HRV (temporary, expected):
- Intense exercise — HRV drops significantly in the 12–48 hours following a hard training session before recovering above baseline (supercompensation)
- Alcohol — even 1–2 units suppresses overnight HRV by 15–25%; the effect is measurable up to 3 nights after heavy consumption
- Illness or infection — one of the earliest measurable signals, often 12–24 hours before other symptoms
- Severe sleep deprivation (less than 5 hours)
- Jet lag and circadian disruption
Chronically lowers HRV (sustained, meaningful):
- Overtraining syndrome
- Chronic psychological stress
- Poor sleep quality or chronic sleep restriction
- Obesity and visceral adiposity
- Insulin resistance and type 2 diabetes
- Hypertension
- Hypothyroidism or hyperthyroidism
- Sedentary lifestyle
- Chronic alcohol consumption
Raises HRV over time:
- Consistent aerobic exercise (the most potent chronic HRV improver)
- Improved sleep quality and duration
- Weight loss
- Stress management practices
- Omega-3 supplementation
- Resonance frequency breathing practice
How to Establish Your Personal HRV Baseline
Garmin establishes your HRV baseline automatically after approximately 3 weeks of consistent wear during sleep. The baseline is a rolling 25-night average, weighted toward recent values, that updates daily.
If you are tracking HRV manually or through an app without automatic baseline calculation:
- Measure HRV at the same time daily — immediately upon waking, before getting out of bed, after 2–3 minutes lying still
- Record for at least 21 consecutive days, excluding nights with known confounding factors (alcohol, illness, travel)
- Calculate your personal mean and standard deviation
- Use ±1 standard deviation as your "normal range" — readings outside this range are meaningful; readings within it are expected variation
Interpreting Your Garmin HRV Status
Garmin's HRV Status categories translate the numerical values into actionable guidance:
Balanced: Your current 5-night average HRV is within your normal baseline range. Autonomic balance is maintained. Continue current training and lifestyle.
Unbalanced: Your HRV is outside your normal range — either elevated (rare; indicates very high recovery or parasympathetic rebound after intense loading) or more commonly slightly below baseline. Review the previous 3–5 days for training intensity, sleep, alcohol, or life stress. Reduce intensity moderately.
Low: Your HRV has been trending below baseline for multiple consecutive days. This is a meaningful physiological signal. Prioritise recovery: reduce training intensity by 30–50%, ensure 8+ hours sleep, and address identifiable stressors.
Poor: Your HRV is significantly and persistently below baseline. This is a strong signal of accumulated physiological stress or developing illness. Reduce training to light activity only, maximise sleep, and consider whether a medical cause (infection, thyroid issue, overtraining syndrome) may be contributing.
References
- Sammito S, Böckelmann I. Factors influencing heart rate variability. International Cardiovascular Forum Journal. 2016;6:18–22.
- Umetani K, et al. Twenty-four hour time domain heart rate variability and heart rate: relations to age and gender over nine decades. Journal of the American College of Cardiology. 1998;31(3):593–601.
- Task Force of the European Society of Cardiology. Heart rate variability: standards of measurement, physiological interpretation, and clinical use. Circulation. 1996;93(5):1043–1065.
- Ramírez E, et al. Heart rate variability as a biomarker of autonomic function: sex and age differences. Frontiers in Physiology. 2021;12:615505.
- Thayer JF, et al. A meta-analysis of heart rate variability and neuroimaging studies: implications for heart rate variability as a marker of stress and health. Neuroscience & Biobehavioral Reviews. 2012;36(2):747–756.
About the Author
Dr. Krishna Athmakuri is the Co-Founder and CEO of Clearcals, where he leads the development of data-driven health technology through the Hint app.
With a Ph.D. in Chemical Engineering from Rensselaer Polytechnic Institute, New York, his expertise spans analytics, protein chemistry, and biotechnology.
Earlier in his career, he developed biotherapeutics for diabetes and metabolic diseases at companies like Aurobindo Pharma and Dr. Reddy's Laboratories.
At Clearcals, he now applies that scientific rigour to build personalised fitness tools — including Hint Pro Workouts, nutrition tracking, and real-time metabolic insights — helping users make smarter health decisions through technology.
Connect with Dr. Krishna on LinkedIn
👉 Back to the pillar page: Heart Rate Variability (HRV): Complete Guide 👉 Related: Low HRV: Causes and What to Do | How to Improve HRV | Garmin Health Metrics Explained